MSCE-EAC (FHCC) Fred Hutch Cancer Center
To provide a mathematical and computational framework for multiscale modeling of the natural history of progression from normal esophageal squamous epithelium to esophageal adenocarcinoma (EAC). Fundamental scales in the MSCE-EAC (MSEAC) model include the cell, crypt, clonal patch, tissue [normal, Barrett's esophagus (BE), high grade dysplasia (HGD), and EAC], individual, and population levels. The development of BE is recognized as an early step in progression to EAC, with an enhanced risk for BE among individuals with gastroesophageal reflux disease (GERD) symptoms. The model represents age-dependent development of weekly or more frequent GERD symptoms, with transitions from both GERD and non-GERD pathways to develop BE, two additional mutations or epigenetic changes for the initiation of HGD, with clonal expansion of cells comprising HGD, malignant transformation, and a more rapid clonal expansion process for EAC. GERD incidence data were utilized to calibrate the model for age-dependent GERD prevalence, and Surveillance Epidemiology and End Results (SEER) incidence data were used for likelihood-based calibration of the remaining parameters of the multiscale EAC progression model. EAC incidence has increased approximately seven-fold in the US since 1975, as reflected in SEER data. These temporal trends were modeled by systematically applying flexible period and cohort trends to the biological parameters of the MSEAC model, and using likelihood methods for model comparison and selection of the best model fit to SEER incidence. To identify which biological parameters may be influenced by temporal trends, we compared alternative models with period and/or cohort effects influencing GERD development, the transition rate to BE, early mutation steps, growth of premalignant lesions, malignant transformation, and clonal growth of the tumor. The best model fit includes a sigmoidal (birth) cohort trend on both premalignant and malignant clonal expansion. Spatial simulations of the growth of premalignant clones (identified with HGD) and malignant tumors are mapped to represent two-dimensional localization and growth on the BE segment of the esophageal surface(represented as a torus). This spatial modeling component of the MSEAC model allows analysis of the probability for biopsy sampling of HGD and preclinical EAC during screening, along with symptomatic cancer detection. This framework is inherently 'multiscale' in that it bridges the cellular scale with the population scale, allowing us to model physically the process of endoscopic screening of BE patients for the presence of premalignant and preclinical malignant lesions prior to the appearance of cancer symptoms and/or a cancer diagnosis.
Contact: Bill Hazelton hazelton@fhcrc.org
Model Overview
The Fred Hutchinson CISNET modeling group in Seattle, Washington has developed a multiscale model to represent the natural history of progression from normal esophageal squamous epithelium to esophageal adenocarcinoma (EAC) (Figure 1). Fundamental scales in the Multiscale Clonal Expansion model of EAC (MSCE-EAC) model include the cell, crypt, clonal patch, tissue, individual, and population levels. Individuals with gastroesophageal reflux disease (GERD) symptoms have an increased risk for Barrett’s Esophagus (BE). The development of BE is an early step in the progression to EAC. The stochastic model represents age-dependent development of weekly or more frequent GERD symptoms with transitions from both GERD and non-GERD pathways to develop BE. Individuals with BE require two additional mutations or epigenetic changes for the initiation of high grade dysplasia (HGD). The initiated HGD cells undergo slow clonal expansion, malignant transformation, and a more rapid clonal expansion process for tumor growth followed by EAC detection.
BE is modeled as metaplastic (changed from smooth to intestinal-type) tissue with a random segment length containing on average 106 BE stem cells. These BE stem cells may undergo mutation or epigenetic modification, with two successive hits occurring during asymmetric cell division (at rates µ0, µ1). The two hits are required to inactivate a gatekeeper or tumor suppressor gene (TSG) and generate a premalignant daughter cell with partial loss of tissue homeostasis.
Figure 1 MSCE-EAC (FHCRC) model structure.*
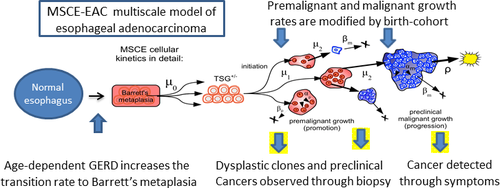
* Reprinted with permission from: Cancer Epidemiology, Biomarkers & Prevention. 2014; 23(6):997-1006. Kong CY, Kroep S, Curtius K, Hazelton WD, Jeon J, Meza R, Heberle C, Miller MC, Choi SE, Lansdorp-Vogelaar I, van Ballegooijen M, Feuer EJ, Inadomi JM, Hur C, Luebeck EG. Exploring the Recent Trend in Esophageal Adenocarcinoma Incidence and Mortality Using Comparative Simulation Modeling. With permission from AACR. [PMC free article]
Premalignant cells, which we associate with high grade dysplasia (HGD), may divide (with rate αp), die, undergo apoptosis or differentiate (at rate βp); or mutate during asymmetric cell division (at rate µ2) to generate a malignant cell. Similarly, malignant cells may divide (with rate αm), die, or differentiate (at rate βm). Diagnostic sensitivity is modeled as a size-based stochastic observation process with a per-cell detection rate (ρ). Stochastic clonal growth rates for each cell type are defined by the difference between the birth and death rates. Model parameters are calibrated through maximum likelihood fits to EAC incidence data from nine registries of the Surveillance, Epidemiology and End Results (SEER) database between 1975 and 2010 (1). Secular trends in EAC incidence were modeled using flexible period and cohort trends that modify the biological parameters of the MSCE-EAC model.
Cell-based spatial simulation modeling of clones in the esophagus was used to track clonal growth and extinction of premalignant and malignant clones that arise through these stochastic cell birth-death-mutation processes. This spatial modeling component of the MSCE-EAC model allows analysis of detection probabilities and predictions related to endoscopic surveillance through biopsy sampling or endoscopic imaging of HGD and preclinical EAC. The clinical calibration to biopsy screening has helped to firm up model assumptions about parameters specifying the number of stem cells per crypt and the crypt-packing in BE and HGD tissues. To replicate current practice with radiofrequency ablation (RFA), we first remove the prevalent EAC cases that were screen detected at the index endoscopy and then simulate RFA treatment on positively screened patients with dysplasia. The ablation is modeled by reducing all clonal populations and the number of BE crypts by certain percentages.
References
- Luebeck EG, Curtius K, Jeon J, Hazelton WD. Impact of tumor progression on cancer incidence curves. Cancer research. 2013;73(3):1086-96.
Bladder models
- Kystis (Brown) Brown
- COBRAS (Ottawa) Ottawa
- SCOUT (NYU) NYU
Bladder Model Comparison Grid (PDF, 145 KB)
See all Comparison Grids & Profiles (Includes historical versions)
Lung models
- BCCRI-LunCan (BCCRI)
- BCCRI-Smoking (BCCRI)
- LCOS (Stanford)
- LCPM (MGH)
- MISCAN-Lung (Erasmus)
- SimSmoke (Georgetown)
- Smoking-Lung Cancer (Georgetown)
- MULU (Mount Sinai)
- ENGAGE (MDACC)
- YLCM (Yale)
- OncoSim-Lung (CPAC-StatCan)
- LMO (FHCC) (Historical)
Lung Model Comparison Grid (PDF, 161 KB)
See all Comparison Grids & Profiles (Includes historical versions)